Turning data into knowledge: Bridging the gap in the terminal industry
Using data to drive operational improvements is a common industry practise, and the port logistics industry is no exception. However, collecting, analyzing and interpreting data to improve operations is not always as straightforward as it might seem. The fact is that the process poses a continuous challenge. The usage of data to improve your operation requires analytical skills and, in many cases, expert knowledge to fully comprehend the meaning of or draw conclusions about the data.
Understanding Data
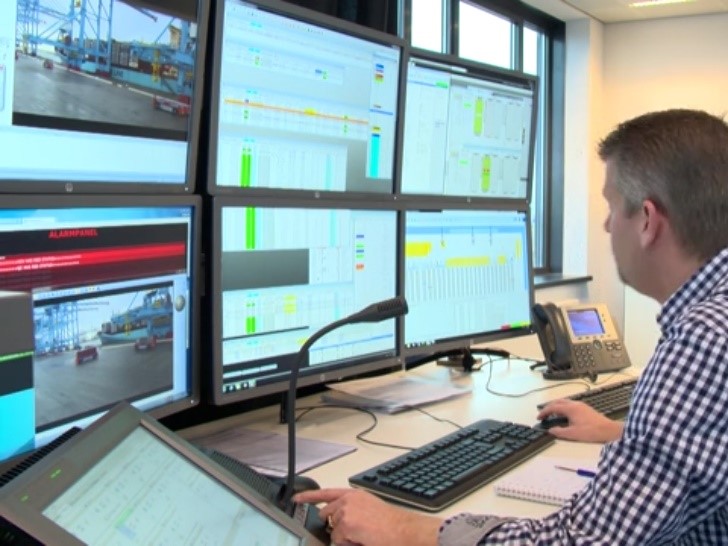
While the collection of good data is still an advanced exercise, software is a great source for data, and automatic logging allows significant data creation. Since many terminals use advanced software in their operations, this is a great opportunity for data analysis. For container terminals, this means they are able to record the activity and location of all equipment over time. It is, for example, possible to count the number of containers handled by terminal equipment or the duration of a cycle. After collecting the data, the main challenge is how to analyze the data and transform it into ‘knowledge’ or insights about the operation.
Software As Source For Data Collection
To analyze the data available in the terminal, we need to determine which data is relevant and need to understand what the underlying processes are. At first glance, some data may seem easy to understand. Counting the number of containers handled by a quay crane (QC) in a certain period is easy to measure – we see how many containers per hour the crane has handled, for example. However, the question of how this information must be interpreted remains. It does not directly provide any relevant insights about the operation, as we do not know what the scope is. In addition to counting the number of containers, the number of twin moves – or whether the QC was loading or discharging – has a big influence on the performance of a QC. Therefore, many terminals struggle with making profitable changes to their operation based on their collected data.
To make a step forward in turning data into knowledge, both data analysis and data interpretation are needed, as both are necessary to create relevant insights. We need comprehensive information to understand the operation at the terminal, and while using data to improve operations has great potential, it is worthless if the data cannot be turned into knowledge. The generated data must therefore be analyzed to transform it into quantitative measurements. Combining different data sets will highlight import parts of the operation. However, this is only a first step, next we need to interpret the data, and for that, we need to understand the data itself, as well as the complementary aspects of the operation.
Transforming Data Into KPIs
A proven tool for process improvement is the use of Key Performance Indicators (KPIs). These KPIs are an extension of data; a summary, or the highlights of the underlying data. KPI’s combine different data values into measurable quantities that are easier to understand. An example of such a KPI is the quay crane productivity. It combines the number of containers handled by the crane with respect to its working time. KPI productivity provides us information about containers per hour which is measurable and quantifiable. These characteristics of KPIs are important because it makes them comparable and thereby understandable. Many different and even less straightforward KPIs can be calculated, such as the average time per move the quay crane is waiting for a terminal truck or straddle carrier. KPIs are well-defined targets that transform data into measurable goals.
These KPIs give relevant information about the operation, such as:
- How many containers per hour are lifted by the quay cranes?
- How many of the vessel moves are twin moves or which percentage is load or discharge?
- Which percentage of their working time do terminal trucks spend waiting in the yard?
- How was work distributed among RMG modules?
Information (data which has been processed into comprehensible material) is a logical step towards knowledge. While KPIs do provide information about operations, unfortunately they do not provide knowledge about it. Hence, a deeper understanding of the processes is needed. Combining multiple KPIs with an understanding of the operation gives tangible insights about the operation. Knowledge includes information about the current terminal performance, as well as the knowhow to adapt to the operation accordingly.
While the actual calculation of KPIs is usually a reasonably simple analytical process (and one that can even be automated) the interpretation of the data, and subsequent generation of relevant operational insights, requires problem-solving skills and expert knowledge about the operation in question. There is not one recipe to solve a problem, each realisation of KPIs needs an understanding of its own. Therefore, completing the step from data to knowledge is not easy to automate. Expert knowledge (the know-how and experience of an expert) is an essential attribute to this.
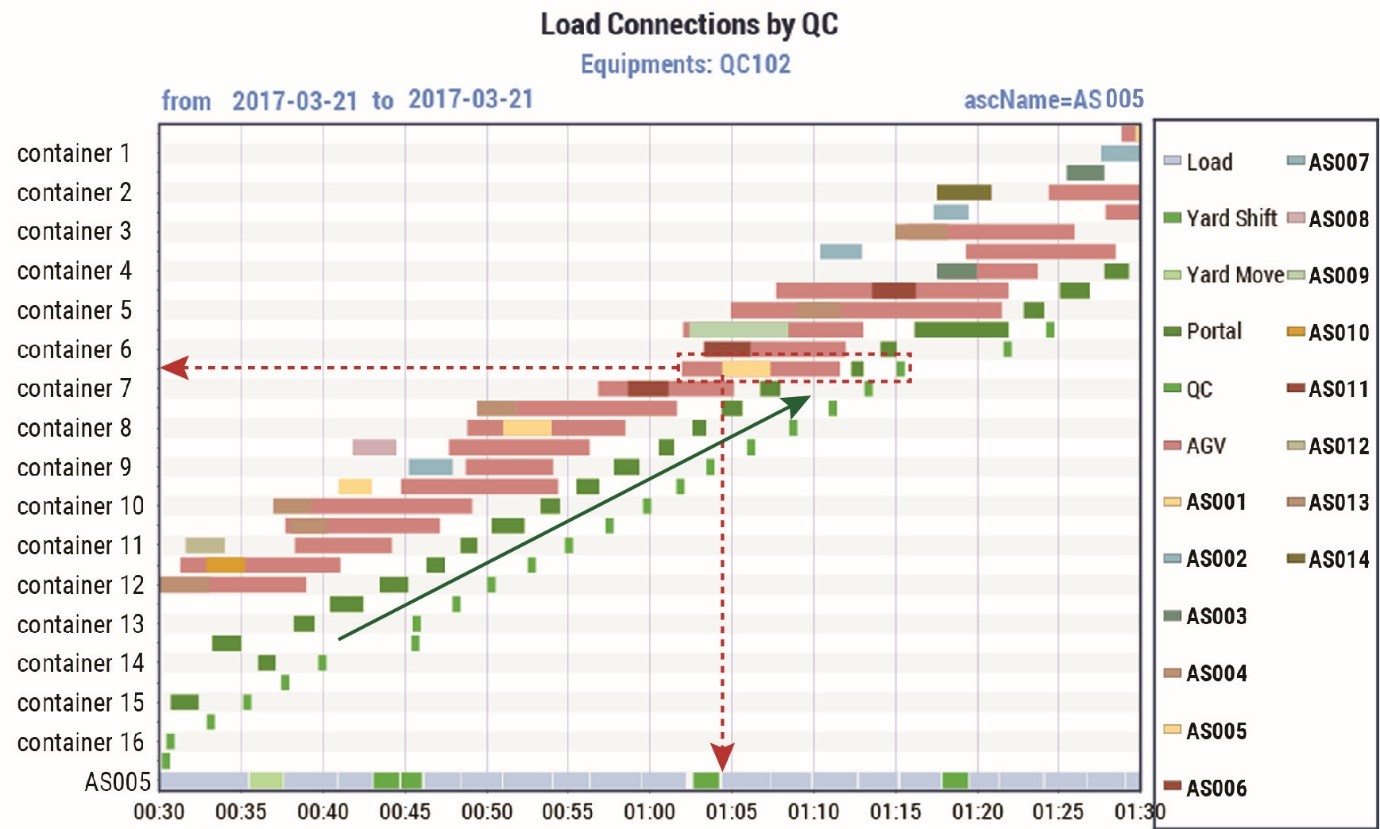
The above visual representation is an example of how KPIs can be transformed into knowledge for this specific operation. This graph shows the completion times of moves for one Quay Crane. The green arrow represents the steadily completing load moves of the QC. Until the point that it must wait for the load of AS005. The yellow part of the bar indicates that the ASC is late on this job execution. At the bottom part of the graph, it becomes visible that AS005 was doing a ‘Yard Shift’ in advance of the load move. It can be concluded that digging out the pile to collect the correct containers was the direct cause of delay at the QC. This real-life example shows how combining job completion times of the QC, ASC and AGV give insight into the cause of a QC delay.
Data And Knowledge: Bridging The Gap
To really understand what is going on we need to take a look at several KPIs simultaneously. If we want to understand how well the QCs have performed on a vessel, we need to know (a.o.):
- The QC productivity as well as the load percentage
- The twin percentage
- The average bay size
- The yard occupancy
- The average pile height/the number of reefers
To compare the QC productivity of one vessel to another, we need many KPIs and we need to understand how they influence each other. The key aspect for this is benchmarks. They can be used to qualify the different KPIs to determine which facets of the operation are ‘good’ or ‘bad’. Benchmarks can be created by using historical data of the terminal or by using the data from other terminals that have similar operational processes. KPIs are useful when these are compared to benchmarks due to their measurable property. A well-defined KPI can be determined for different terminals even if their underlying data is different.
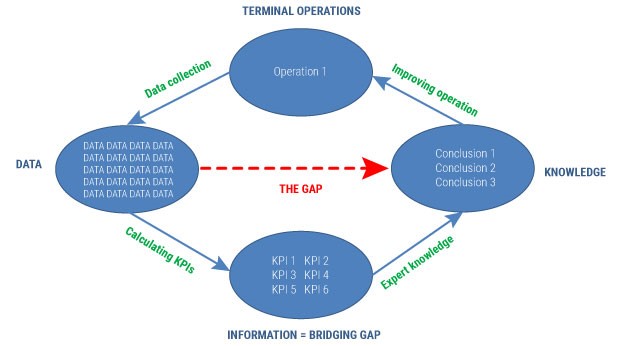
To bridge the gap from data to knowledge, we need to use KPIs as an extension to the data. Well defined calculations are needed to transform data into measurable quantities. By combining different KPIs, valuable insight and/or knowledge about operations can be acquired. To make this final step from KPIs to knowledge, benchmark values and analytic skills of an expert are of utmost importance. By using this approach, data analysis can help to continuously improve operations in the terminal industry.