Roadmap towards zero emission needs a holistic view
Challenges faced by container terminals in preparation for zero emissions
The road towards zero emissions is fraught with a wide range of challenges and unanswered questions. In our daily conversations with container and bulk terminals, there are so many unknowns, underestimations, and concerns—for example:
- What technologies and solutions to consider.
- What should be the roadmap and priorities.
- Transition risks to existing operations and terminal performances.
- Lack of economic viability due to more expensive equipment and additional infrastructural investments.
- Insufficient grid capacity for increasing power demand.
Equipment OEMs, solution providers, and other stakeholders are making efforts to address these challenges by offering their services and contributions. However, when all these come to the container terminal’s table for final decision-making, this becomes a complex puzzle and a complicated task for terminals to plan their roadmap to achieve the zero-emission goals.
A holistic approach to address challenges in preparation for zero-emission operations
To address these challenges effectively, a holistic approach is key to success. The first important step is setting the right starting points per case in objective and inputs (e.g., terminal’s operational characteristics, local circumstances, layout footprint, demand patterns, etc). Once the right starting points are defined, the relevant and most suitable potential solutions—whether technology and hardware related or various optimisation measures—can be properly identified.
Comparing various possibilities involves difficult operational and design decisions across a broad range of aspects, including operations, layout, technology, equipment, performance, infrastructure, supply, financials, and more. Investigation on all these variables as a whole is required to understand the dynamics and interrelation between these variables and their intertwined impacts. Therefore, a holistic approach becomes essential to ensure the right decision on the best solution. While no single solution can apply to every case, the holistic principle itself is universally applicable (Figure 1 shows this stepwise holistic approach and examples of decision variables).
In the remainder of this section, we will use selective case studies from our work to showcase why it is important to adopt such holistic views to determine the solutions that best meet container terminals’ operational needs, business viability, and zero-emission targets.
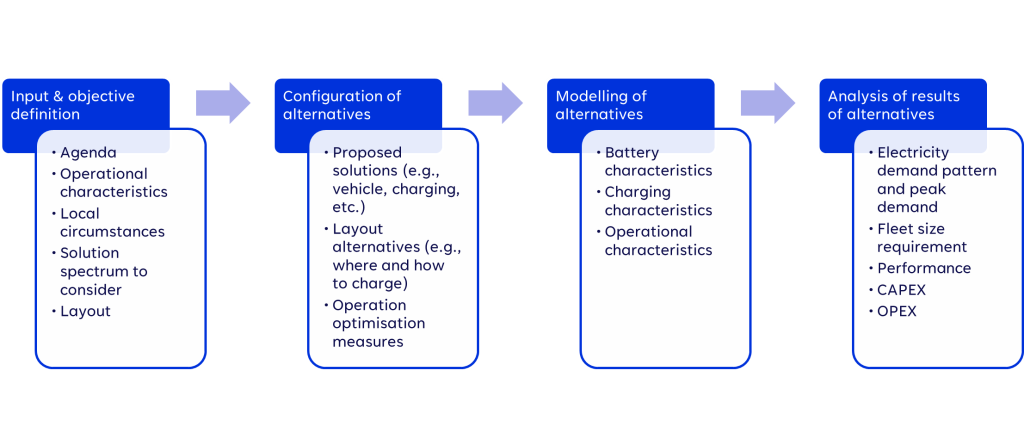
Figure 1: Stepwise approach to holistic design
How to decide on container terminal electrification: trade-offs
The selection and prioritisation of key variables can significantly shape the decision-making process. A simplified case study where we analysed the requirements of fleet and charger numbers showcases the required trade-offs.
In this example, a container terminal requires 10 battery-electric terminal trucks (eTTs) for a continuous operation with a 4-hour working shift and 30-minute breaks per shift. The trucks for each shift should operate for 3.5 hours without charging, with no spares considered. The trucks have a nominal battery capacity of 200 kWh and consume ~40 kWh per hour of operation. Charging happens at 300 kW/hour on average. Different decisions can be made regarding the number of trucks versus chargers. Option 1 involves purchasing 10 trucks and 10 chargers. Each truck could consume 140 kWh (3.5h*40kW) per shift and charge 150 kWh (0.5h*300kW) (Figure 2). This avoids the need for extra vehicles, as they are charged in each break, but charging all 10 trucks simultaneously results in a peak power demand of 3,000 kW.
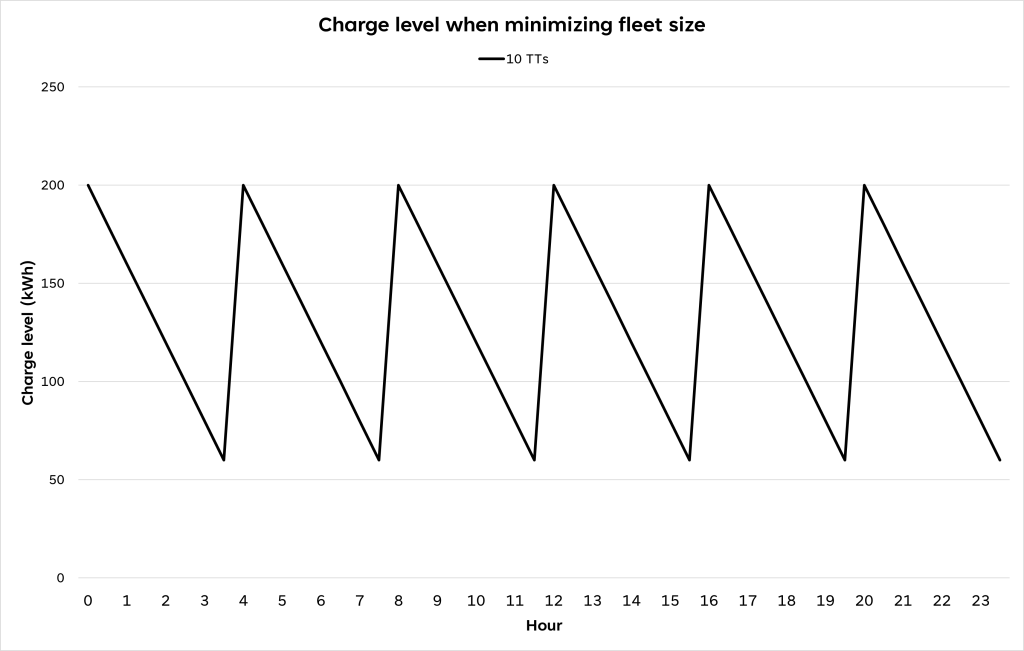
Figure 2: This figure shows the charge level of a single truck’s battery in case trucks only charge during breaks (option 1).
Option 2 considers purchasing only five chargers but 15 trucks. Each truck will have one idle shift for every two operational shifts, allowing charging outside the scheduled breaks. The peak charging power demand equals 300kW*5 = 1,500 kW only. Battery charge levels in this option for each subgroup of five trucks are shown in Figure 3. When the charge level is constant for some time, this means that the truck is idle.
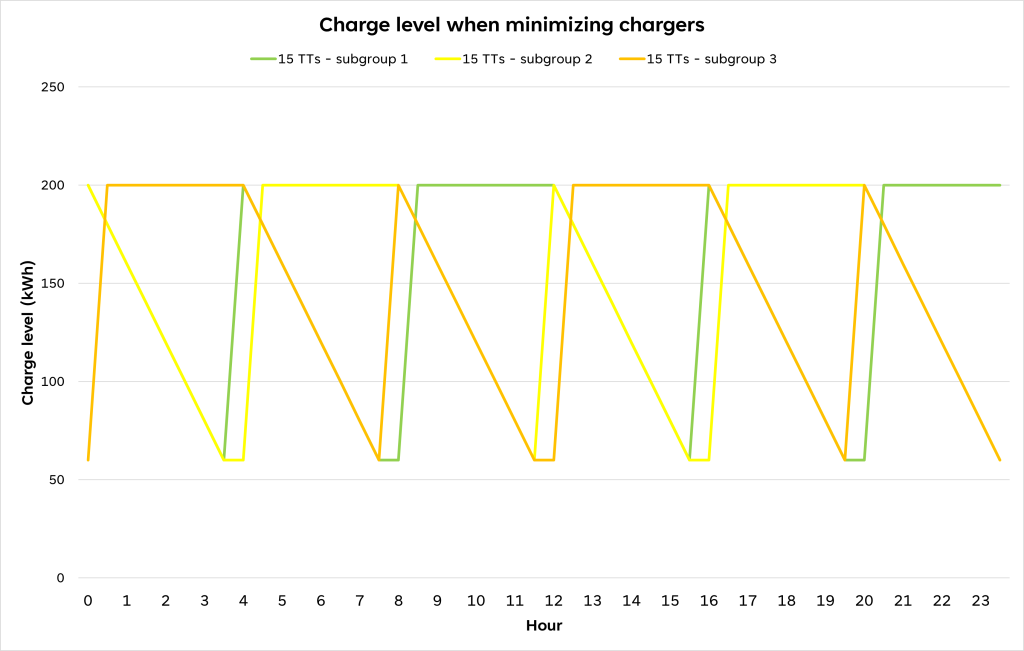 Figure 3: This figure shows the charge level of three trucks belonging to different subgroups in case the charging peak is reduced by purchasing additional trucks and fewer chargers (option 2).
From an investment perspective, option 1 has lower CAPEX, since chargers cost less than trucks. However, once we factor in other possibly influencing aspects—such as different battery lifetime and replacement costs—option 2 may have a lower total cost of ownership, because of the increased depreciation period from the idle times and enabled slower charging rates. Additionally, limited grid capacity may make full-fleet charging (option 1) unfeasible given its more significant power spikes. Alternatively, limited grid capacity may need upgrading, resulting in higher overall CAPEX.
Yet again, the decision might become different if the container terminal considers using the same chargers for other mobile terminal equipment. How these variables are considered shapes decision preferences. In this example, the terminal might choose differently if it considers options like battery swapping or opportunity charging.
What solutions fit operational needs best: it is a delicate balancing act
Simply adopting the technology itself does not guarantee maintaining the performance levels. Instead, it must be carefully integrated to meet specific requirements. To continue with the eTT case, the chosen charging strategy highly impacts the operational performance and requires decisions on many factors (Figure 4) such as:
- Charging solutions, e.g., wired or opportunity charging, or battery swapping.
- Battery size and charging capacities, e.g., AC/DC or mega-watt charging speed.
- Charging locations, e.g., centralised vs. decentralised.
- Charging timing, e.g., % of eTTs are charged during or outside shift, or need-to-charge vs. nice-to-charge depending on the battery level.
- Charging duration, e.g., fixed vs. variable charging time.
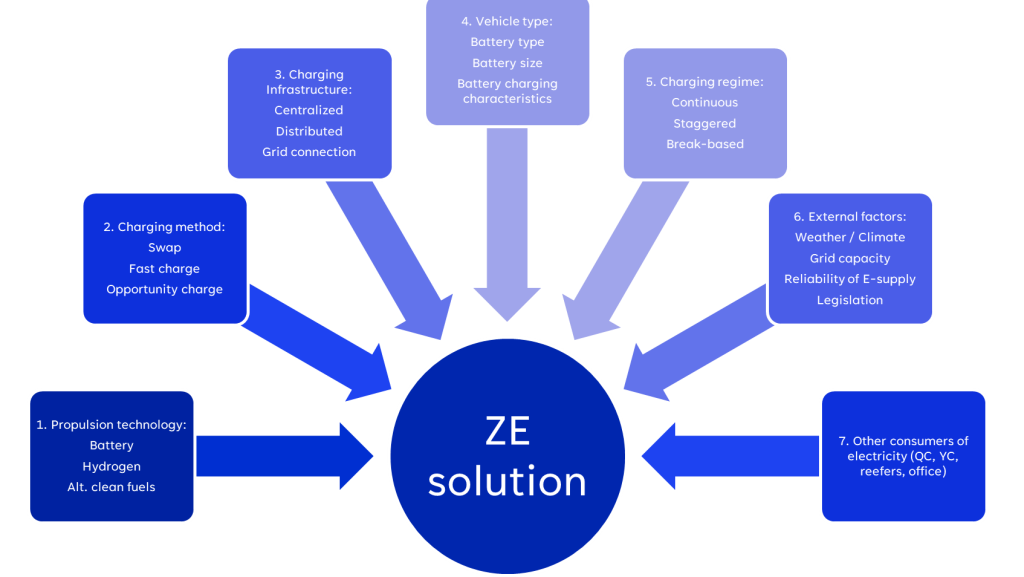 Figure 4: Factors to consider when designing a zero-emission solution
The most suitable charging strategy will depend on the terminal’s operational needs. In the above terminal example with breaks/frequent off-peak hours, the breaks can be used for wired charging. However, in a different case of intensive 24/7 terminal operation with limited breaks, opportunity charging during the continuous operation can become the preferred solution to prevent downtime and limit the need for spares.
It is a delicate balancing act between maintaining stable battery levels and operational performance. Frequent or longer charging—even during productive moves—can inevitably lead to performance losses and impacts on productivity. A recent container terminal simulation study showed that a mere two-minute difference in opportunity charging duration led to a significant difference in quay crane performance and fleet battery level at the end of one shift operation.
While two minutes may seem minimal, it actually constitutes a significant proportion of the typical 10-15 minute eTT operating cycle. The two-minute charging duration could also mean a significant difference in whether the energy loss per TT cycle can be offset. Similar dynamics were observed when we tested simulations with, for example, different thresholds for need-to-charge of eTTs, different charging speeds, alternative location setups, or implementing smart intelligence in managing energy use and charging schedules.
Such dynamics are further complicated by new innovation developments such as mega-watt charging, inductive/conductive charging, and automated charging solutions. Our experience shows that advanced tools like simulation (Figure 5) can be effective to quantify the dynamics between these relevant variables.
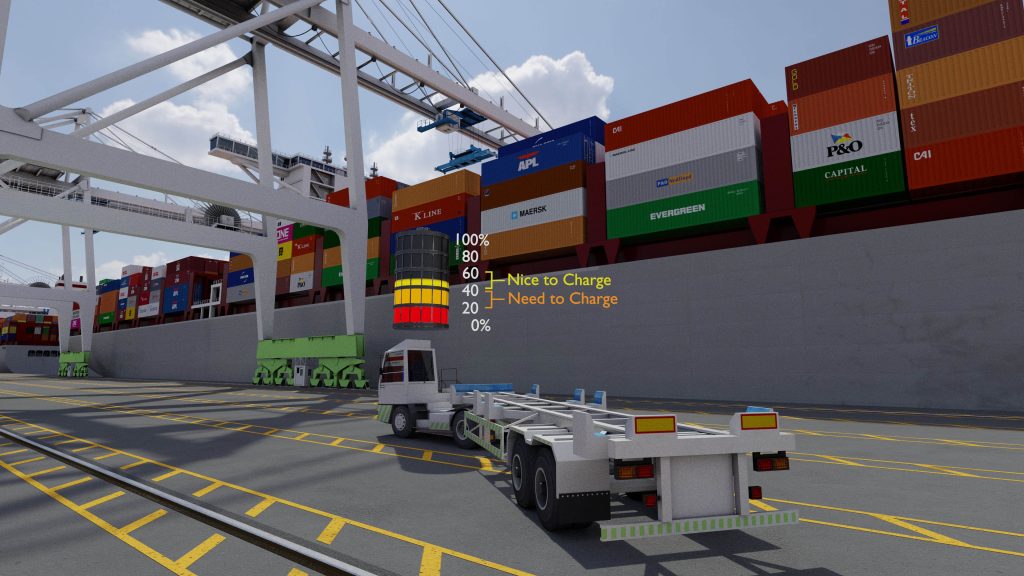
Figure 5: 3D simulation of eTT on site
Where the business case lies: holism, pragmatism, and creativity are needed
As discussed, the dynamics of a terminal’s condition and operations affect the terminal’s decision-making. Ultimately, the final decision-making still largely depends on the business case. Despite the mandate and needs driven by policies and regulations, CAPEX/OPEX and ROI remain decisive factors.
The biggest hurdle terminals face is still the substantial extra investment for electrification. We could arguably expect future technology developments in cost reduction and more industrial adoption for favourable business undertakings. Yet, the extra CAPEX still outweighs the potential OPEX savings from less energy and maintenance cost, at least per current market price levels, limiting direct business viability of electrification (reflected also in ZEPA’s publication “Reaching a tipping point in Battery-Electric Container Handling Equipment”, October 2023). This unavoidably causes dilemmas and hesitations among terminals, especially those with limited financial resources, on whether, when, and how to meet approaching zero-emission regulation deadlines.
To address this, financial support via government subsidies and contributions from external stakeholders, such as shipping lines and port authorities, will remain the key facilitator in the foreseeable future. Still, within a terminal’s own scope, taking holism, pragmatism, and creativity into planning can lead to a viable business case that balances operational needs, environmental aims, and financial viability.
To broaden the discussion with a few other examples: when planning a site’s shower power demand, while the IEC 80005-1 international standard recommends a high-voltage system of 6.6 kV or 11 kV at 60 Hz, with a 2-7.5 MW capacity, our experience actually shows that container vessels mostly need between 2-4MVA.
In vessel berthing planning, designating different vessels to specific berths enables optimisations on shore power demand and usage, without compromising vessel service levels (verified via berth simulations).
In another study, we used simulations to size the electricity demands under various operational conditions across all the electricity consumers at a terminal. The results revealed that there is no need to design absolute peaks for grid demand. Instead, it is possible to still meet the needs by combining current sources by switchgears or reducing electricity consumption (e.g., reefers, subset of grid-connected CHEs, mobile equipment charging) at the proper time without impacting operation and performance.
There are many similar examples from our experiences showing such a holistic systematic approach in creating or finding out viable business cases.
Concluding and looking ahead
The road to net-zero still needs substantial progress and more action and collaboration from various stakeholders. Yet, time is ticking and already calls for the immediate commencement of preparation and planning.
From our experience, it is clear that a holistic view and systematic approach are essential in sorting out various complexities to form a sensible and economically viable roadmap. There is no doubt that more challenges are still ahead along the bumpy road before the industry reaches the final destination. Such a holistic view will remain as one essential key to success.
About the authors:
Dr. Zack Lu works as a Senior Project Manager at Portwise. In the last 12 years, he has worked in various terminal projects related to design, simulations, operation optimisation, automations, etc.
Dr. Isabelle van Schilt works as Project Manager at Portwise. Her expertise focuses on dealing with (deep) uncertainty, data sparseness, and robust decision-making in the ports, logistics, and supply chain industry. She holds a PhD degree in supply chain simulations from Delft University of Technology.
Pim van Leeuwen works as a Project Manager at Portwise. He has a background in Econometrics and Operations Research has extensive experience with electrification and design projects using detailed simulations.
This article has been published in PTI Journal Edition 150.