Maintaining reliable quay crane productivity in RTG terminals with high storage density
Last month, Suzanne Wiersma completed her master thesis in Multi-Machine Engineering at the TU Delft. Her thesis was based on research done at Portwise, with the help of our world-renowned simulation tool TIMESQUARE.
I (Arjen de Waal) supervised this research on behalf of Portwise and I like to share some insights with my readers. We studied the impact of density in the storage yard of container terminals on quay crane productivity, and how to reduce the drop of productivity at high densities. Suzanne discovered one solution that works counter-productively, and one that showed huge potential to maintain good and reliable productivity, even at densities under which traditional RTG storage solutions would not work at all.
This research started by testing the impact of storage density on quay crane productivity in a typical RTG terminal. The higher the density, the less flexibility remains for efficient stacking – which causes imbalanced workload distribution over RTGs and increasing drive distances of terminal trucks, as well as an increase in the number of shuffles (removing blocking containers on top of a container that must be retrieved). Therefore, it is no surprise that productivity drops at higher density, and especially fast above 80% density:
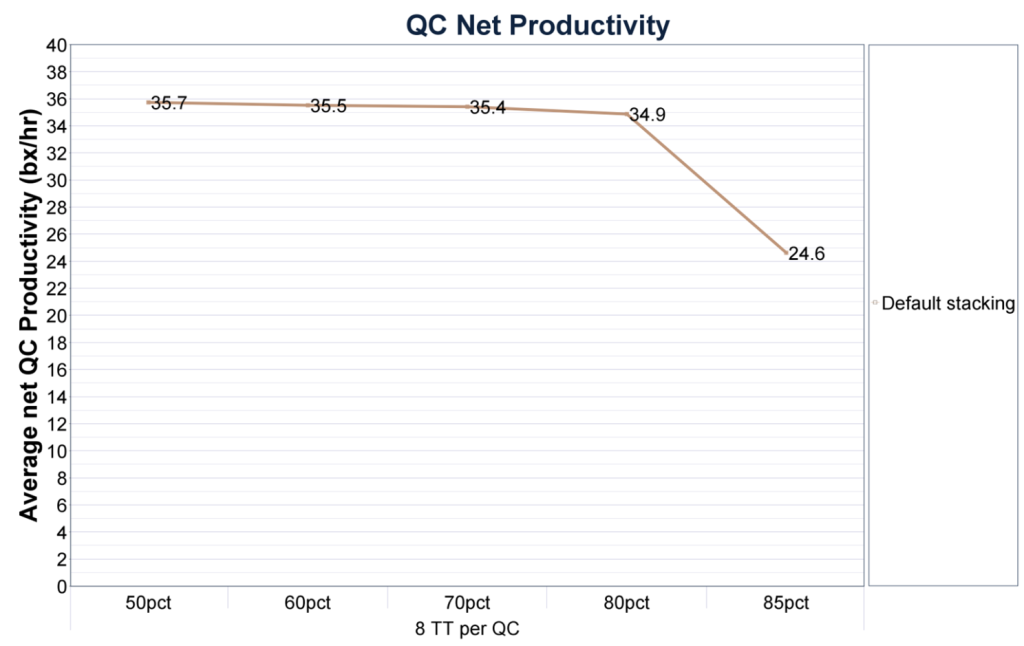
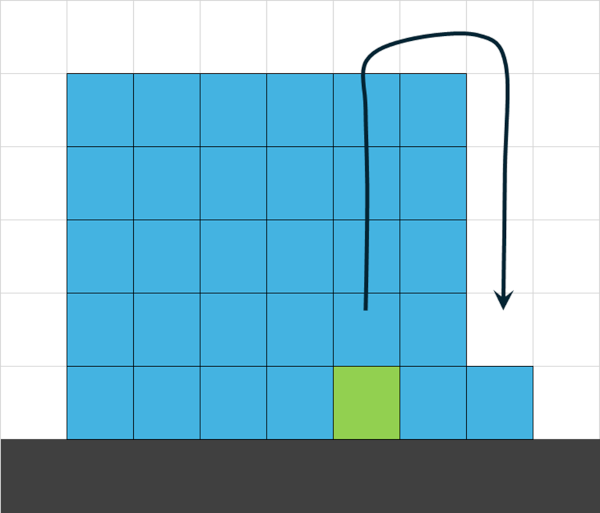
RTGs usually work with a strategy in which shuffles need to be executed within one stack bay. To reach each container in the bay, at least 4 slots must remain empty in the example below. All four containers on top of the green container can be moved to the empty slots such that the green container can be reached. In this example with 7 rows wide and 5 tiers high, there are 35 slots available of which 31 can be used. This means that the maximum density in such a stack is 31/35 = 88.5%. Considering this, it makes sense that the productivity of the terminal drops heavily at a density of 85%: 96% of the available slots are then occupied.
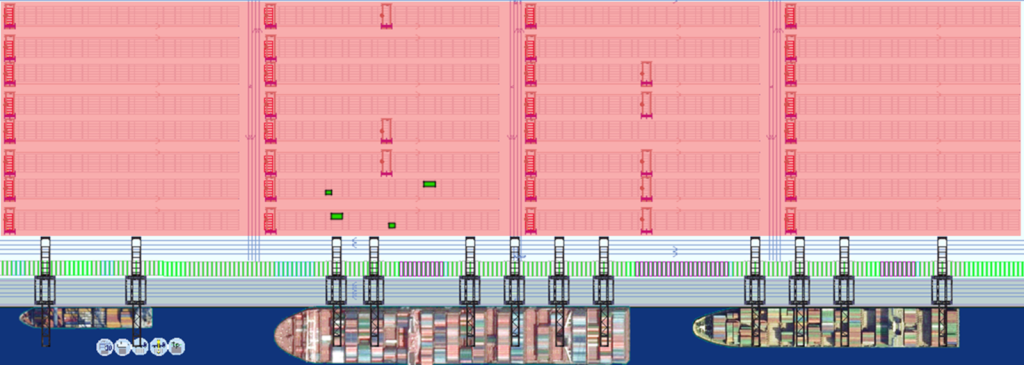
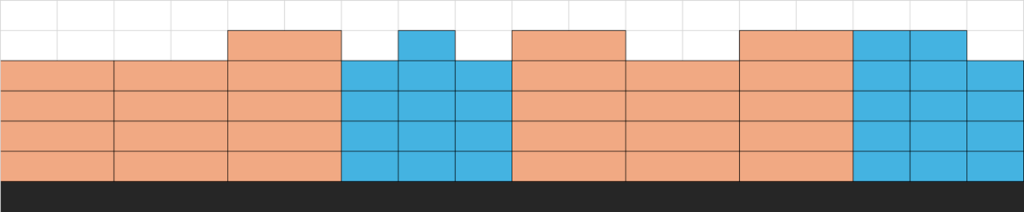
Below, the screenshot of the simulation model shows an exaggerated view of a few slots that might still be available under this high density in green and the unavailable slots in red (there are usually more slots available than shown here). A container that must be stored either must go to one of the green slots, possibly causing a high workload in that area, and using a slot that is not ideal for the specific container type and destination, or wait until a more convenient position becomes available. Either way, productivity drops.
We have been looking at ways to increase the available storage slots and thereby improve on the flexibility to store containers in convenient locations.
Solution 1: change drive lanes into storage slots
First of all, we tested the impact of creating more storage space by closing one or more drive lanes. We started with a density of 83%: a density in between the earlier tested 80% and 85% that the default RTG stacking strategy could just manage (80% was manageable and 85% was nearly impossible).
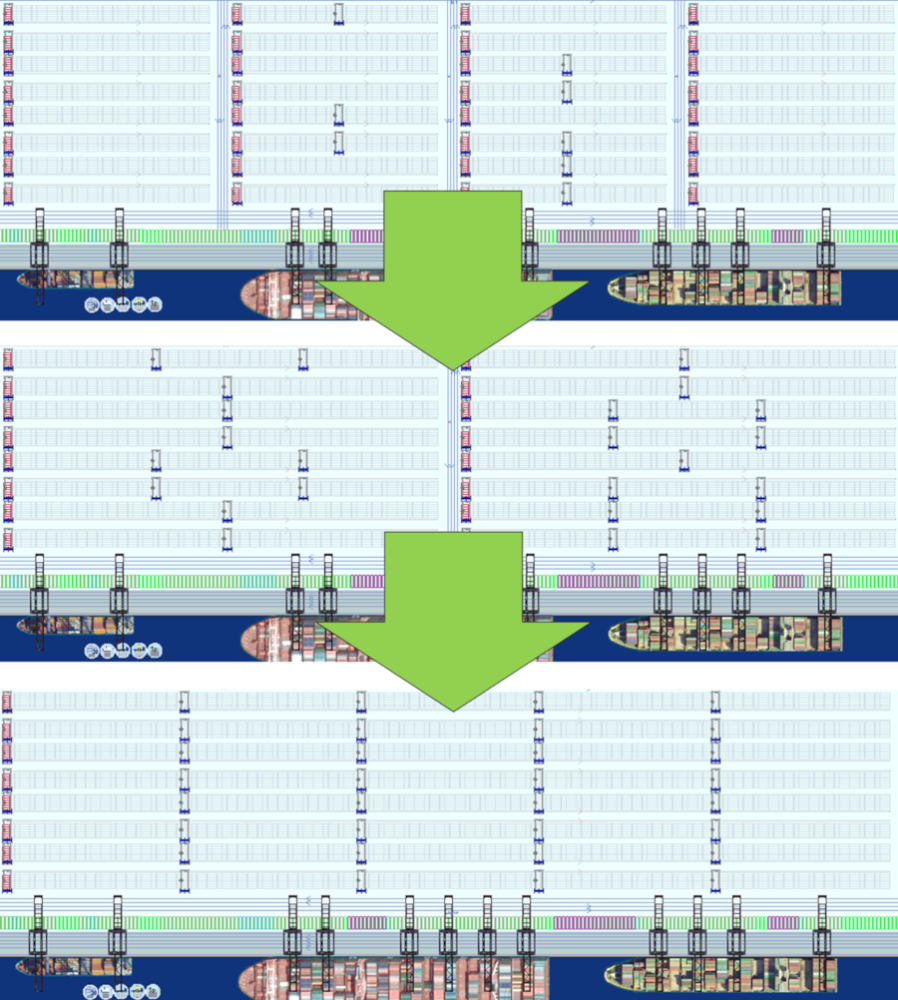
This is done in two steps as shown below. In the first step, we closed two vertical drive lanes such that the number of ‘columns’ with RTG blocks decreased from 4 to 2. This change increases the available storage ground slots by 6%. The storage density decreases from 83% to 78% with this change, which gives much more flexibility in stacking. Downsides are the increased drive distance of terminal trucks that drive between stack and quay, increased congestion, and less flexibility for RTGs to drive between stack lanes.
In the second step, the only remaining vertical drive lane in the center is closed and replaced with storage slots. This increases the number of available ground slots by 3% extra. Storage density decreases to 76%.
We tested this solution with simulation. The results were disappointing, but very clear: this solution does not work in high workload situations. The large amount of traffic cannot move through the yard efficiently.
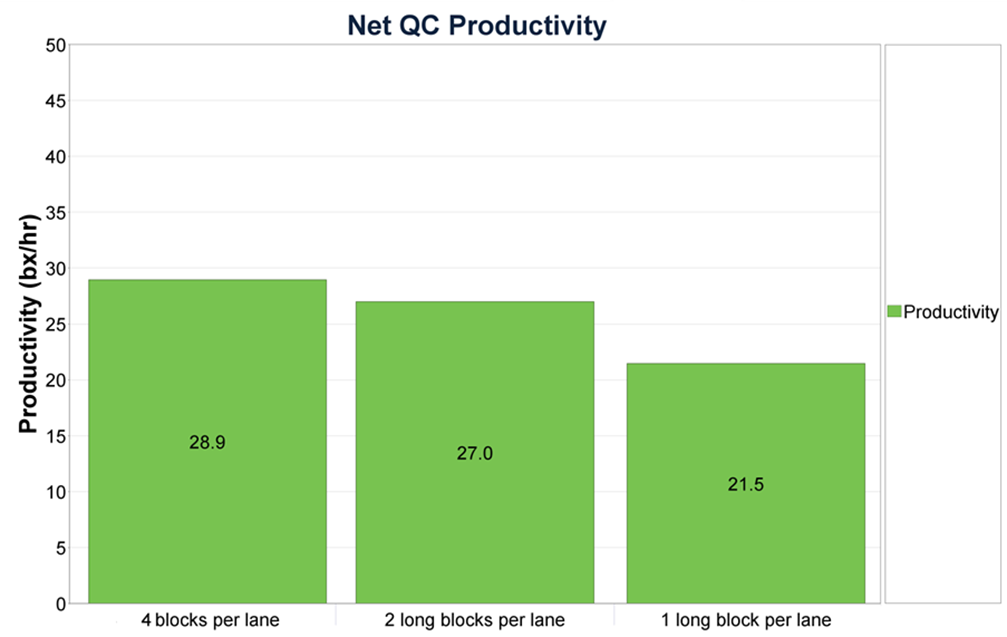
Net QC Productivity with 4, 2 and 1 RTG block per stack lane
The Net QC Productivity KPI shows that the quay crane productivity drops after closing drive lanes. The solution with one large RTG block per lane performs worst.
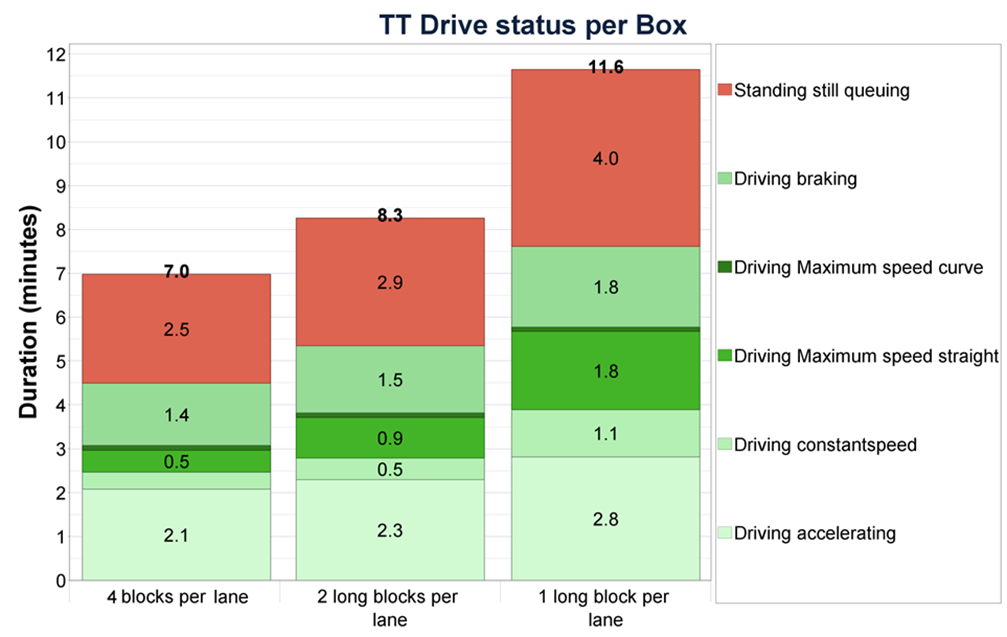
Terminal Tractor drive status per box with 4, 2 and 1 RTG block per stack lane
The TT Drive status per box KPI shows how long Terminal Trucks are driving to transport one container. This includes an unladen drive to pick up a container and a laden drive to deliver the container. With the default strategy, TTs drive 7 minutes per box on average, of which 2.5 minutes of queuing (the red bar). In the layout with 2 long blocks per lane, this increases to 8.3 minutes (2.9 minutes queuing), and with 1 long block to 11.6 minutes (4 minutes queuing).
The benefit of increased flexibility in the yard cannot mitigate the big loss of TT productivity that is caused by the increased drive times.
In conclusion, the solution does not help in the effort to mitigate quay crane productivity drops in RTG terminals with high storage density.
Solution 2: alternative shuffle policy
We now know what does not work. We did not give up and Suzanne developed a new alternative: Multi-bay with Sets Shuffle Policy with Clustered Bay Distribution. This strategy is briefly explained as follows:
- Multi-bay with Sets Shuffle Policy means that it is allowed to move shuffle containers between a dedicated set of bays, in most cases 3 bays per set.
- Clustered bay distribution means that the storage blocks are designed with clusters of 20ft and 40ft bays such that drive distances with shuffles are minimized. RTGs can drive with a container between bays but slowly, and preferably not too often; therefore we like the shuffle bays to be close together.
Most clusters are created like the side view shown here, 3 bays for 40ft containers, 3 bays for 20ft containers etc. (more clusters of 40ft containers in total, aligned with used TEU-factor of 1.6).
If shuffles are allowed to be executed between bays of the same cluster, this gives possibilities like those shown here (top view):
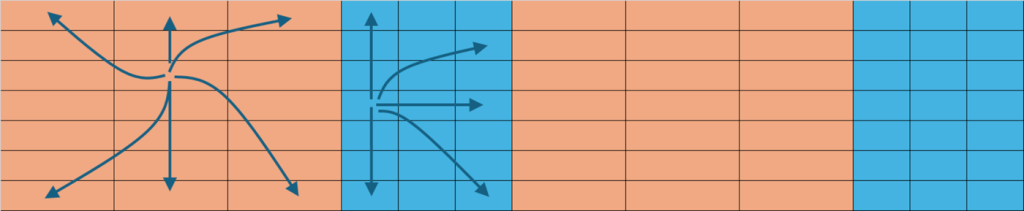
This solution gives more flexibility in the yard. No longer do we need 4 empty slots per individual bay to do shuffles, but 4 empty slots per cluster of bays. The maximum usable storage slots increase from 31 slots per bay of 35 slots (88.5%) to 101 slots per 3 bays of 105 slots (96%).
This means a lot more slots are available for stacking containers, making it possible to select convenient slots for the container type and destination, with relatively short drive distances for terminal trucks, and balancing the workload over RTGs.
A comparison between the original strategy and the new solution is made in the exaggerated top view with infeasible (red) and available (green) slots:
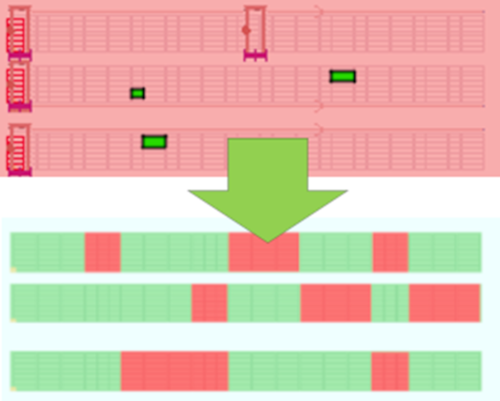
This solution was of course also tested with our renowned simulation tool TIMESQUARE. The results exceeded our expectations tremendously! Not only performed the terminal slightly better than the default strategy at lower storage densities, but it maintained good productivity not only at 85% density but even at 90%, where the default strategy can no longer work at all.
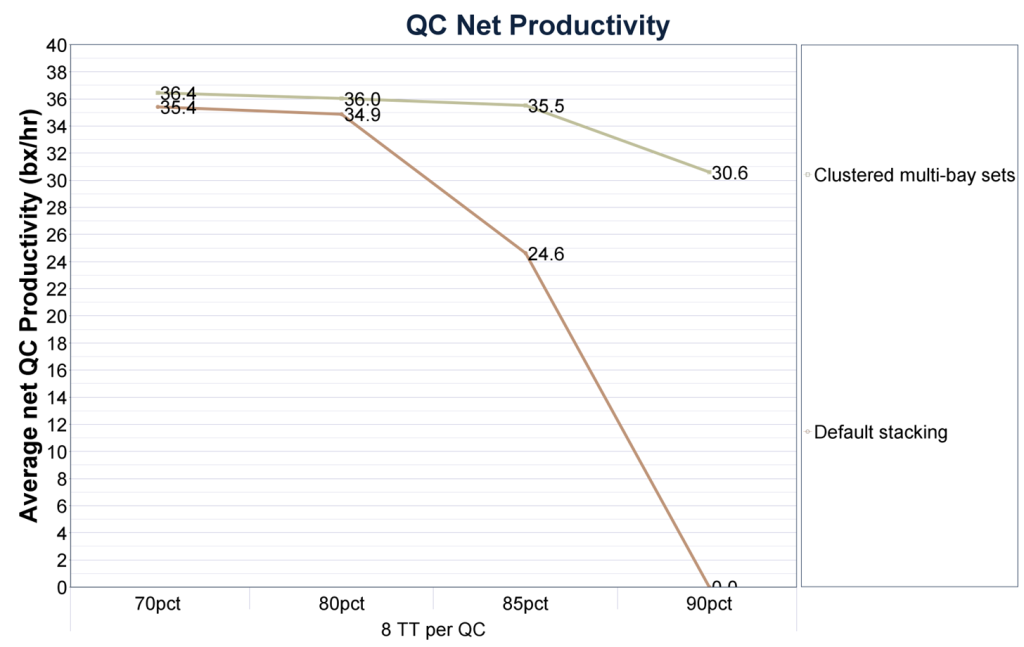
QC Net productivity under different storage density, for two strategies
A downside of this strategy is that RTGs need to gantry with containers which can cause some additional maintenance. We measured how often a shuffle between bays is performed and found out that this is not as often as you might expect under high densities: approx. 20% of all shuffles are now performed between bays, at 85% density. For our ‘typical’ 12-QC RTG terminal this means 30 to 40 shuffles between bays per hour, in peak hours.
We conclude the analysis of the new strategy by investigating how the workload distribution of RTGs differs between the new ‘Clustered multi-bay sets’ policy and the default stacking strategy.
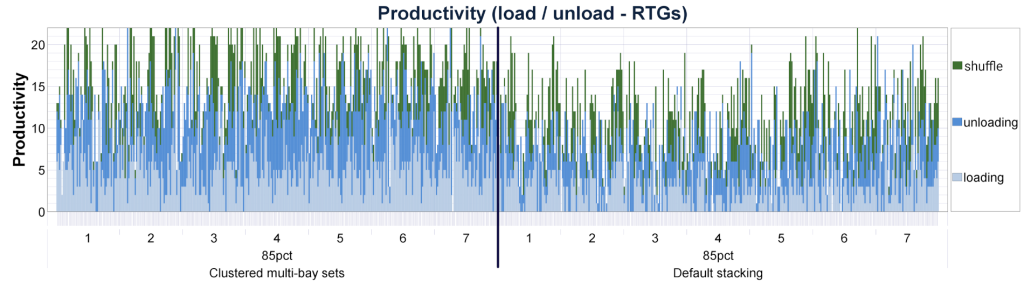
This graph shows the individual RTG productivities in individual hours, for two experiments. We can see that in both experiments, productivities of 22 bx/hr per RTG occur, as well as hours with low productivities for individual RTGs. However, the hours with high productivity of individual RTGs occur much more frequently with the new ‘clustered multi-bay sets’ strategy (the left half of the chart), while hours with low productivity occur much more frequently with the default stacking strategy.
Conclusion
Overall we can conclude that the new strategy has done what we intended to do: improving the workload balance of RTGs and thereby maintaining good and reliable quay crane productivities, even at very high storage densities.
Can we help you too?
Every container terminal is unique. Each terminal has its specific layout, container flows, workload, operating system and strategies, equipment specs and equipment numbers. This makes the implementation and impact of a solution as described in this article different for each terminal. At Portwise we have the tools and people to investigate how this concept would work for specific terminals. Feel free to contact us if you would like to know more.
*This article has been posted on LinkedIn and is written by Arjen de Waal, Head of Simulation at Portwise.